This is the first post on this blog that actually has a graph on it!
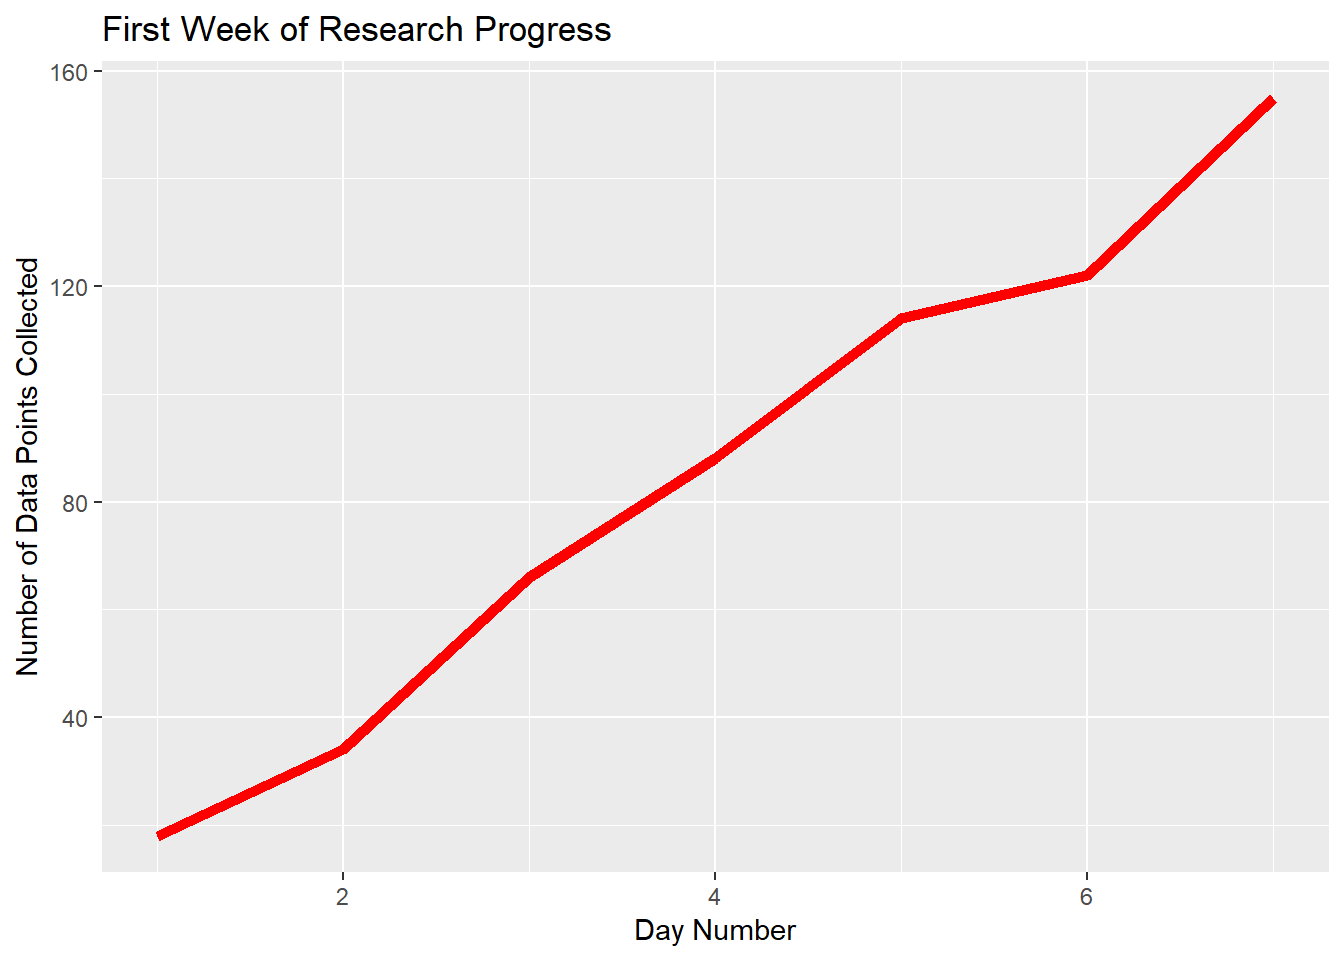
One project for my research currently involves measuring 500 different images of Anolis claws. This is no small task, considering that each image takes up to four minutes to complete. This graph shows how many Anolis images I was able to complete in the span of one week, which is looking pretty good at 155 images.
So theoretically, if I am able to continue at this rate, I’ll be done with data collection (hopefully!) in approximately…2.5 weeks! (We’ll see if that turns out to be true). My goal is to get this data crunched by the end of the semester, so it looks like I’m still on track!
I plan on updating this graph weekly until I’m finished with the data collection, so stay tuned!