Like many college students, I have used a dating app to look for “that special someone.” Unlike other college students, I am most strongly interested in doing it for science.
Running The Tests
Once I had swiped enough, noting down whether I had swiped right (yes) or left (no) and the person’s gender (Side Note #1: I’m bisexual), I collected this data about my choices.
##     females males
## no       40   893
## yes      19    48
I wanted to test whether there is a difference in the number of women I swiped yes on versus the number of men (Side Note #2: While gender is not a binary, Bumble categorizes it as such). To do this, I ran a two-proportion z-interval test in R.
prop.test(x=c(40,19),n=c(893,48))## Warning in prop.test(x = c(40, 19), n = c(893, 48)): Chi-squared
## approximation may be incorrect##
## 2-sample test for equality of proportions with continuity
## correction
##
## data: c(40, 19) out of c(893, 48)
## X-squared = 89.636, df = 1, p-value < 2.2e-16
## alternative hypothesis: two.sided
## 95 percent confidence interval:
## -0.5010252 -0.2010558
## sample estimates:
## prop 1 prop 2
## 0.04479283 0.39583333The p-value is incredibly small, meaning that there is a significant difference between the proportion of men accepted and the proportion of women accepted. (Side Note #3: I do not speak for the bisexual population as a whole. Sexuality is a spectrum; there is no “right way” to be bisexual.)
Beyond this, I also tracked whether the person and I messaged each other. However, several factors meant that I was not able to collect sufficient data to run the test. First, I was accidentally so selective in my initial swiping that I did not have the ten successes and failures needed. Second, I was using the dating app Bumble, which requires for heterosexual parings that the female message first in an attempt to make the environment safer for women, so I felt as though that might introduce additional error than Tinder, where once a match occurs, either party can start the conversation.
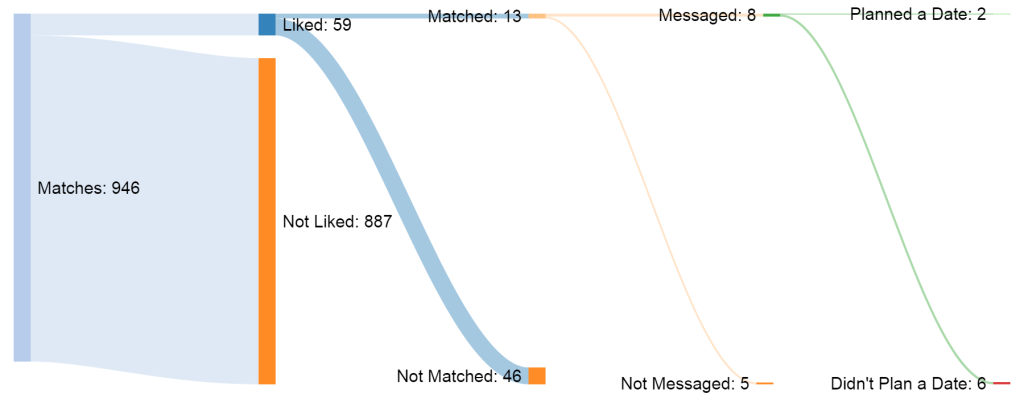
Making the Sankey Diagram
Unfortunately, I lack the R skills to make a Sankey diagram. An R package called Plotly is supposed to help, but I was not able to figure out how to actually input my data, so the diagram below was made with the website SankeyMATIC, with my sincerest apologies. As my R skills improve, I’ll revisit creating this diagram in R.
Sources of Error & Conclusions
Due to the opinionated nature of online dating, there was bias in the data collected. Secondly, for some reason Bumble had a lot of glitches where I would see someone’s profile that I had already rejected, which may have artificially inflated the percentage of rejections, although this likely didn’t impact the p-value too much. In addition, Bumble is dependent on locality. Although I never strayed far from the Boston area, the radius of 50 miles which the app was automatically set to did change slightly as I commuted around (from work to school to home) which could have influenced the people I was able to swipe through.
But after my brief foray into Bumble, alas, although I did plan two dates and went on one, nothing panned out, and I am still single. (Side Note #4: Please do not slide into my DM’s over this post.)