In this post, I’m going to talk a little bit less about graphs and data, and more about outreach.
As a minority in STEM, I’m really interested in outreach, science commmunication, and the increase of diversity in my field. So when the STEM Ambassadors Program at UMass offered the opportunity to create an activity centered around my research interests to “pitch” my science to a group of middle schoolers, I jumped at the chance.
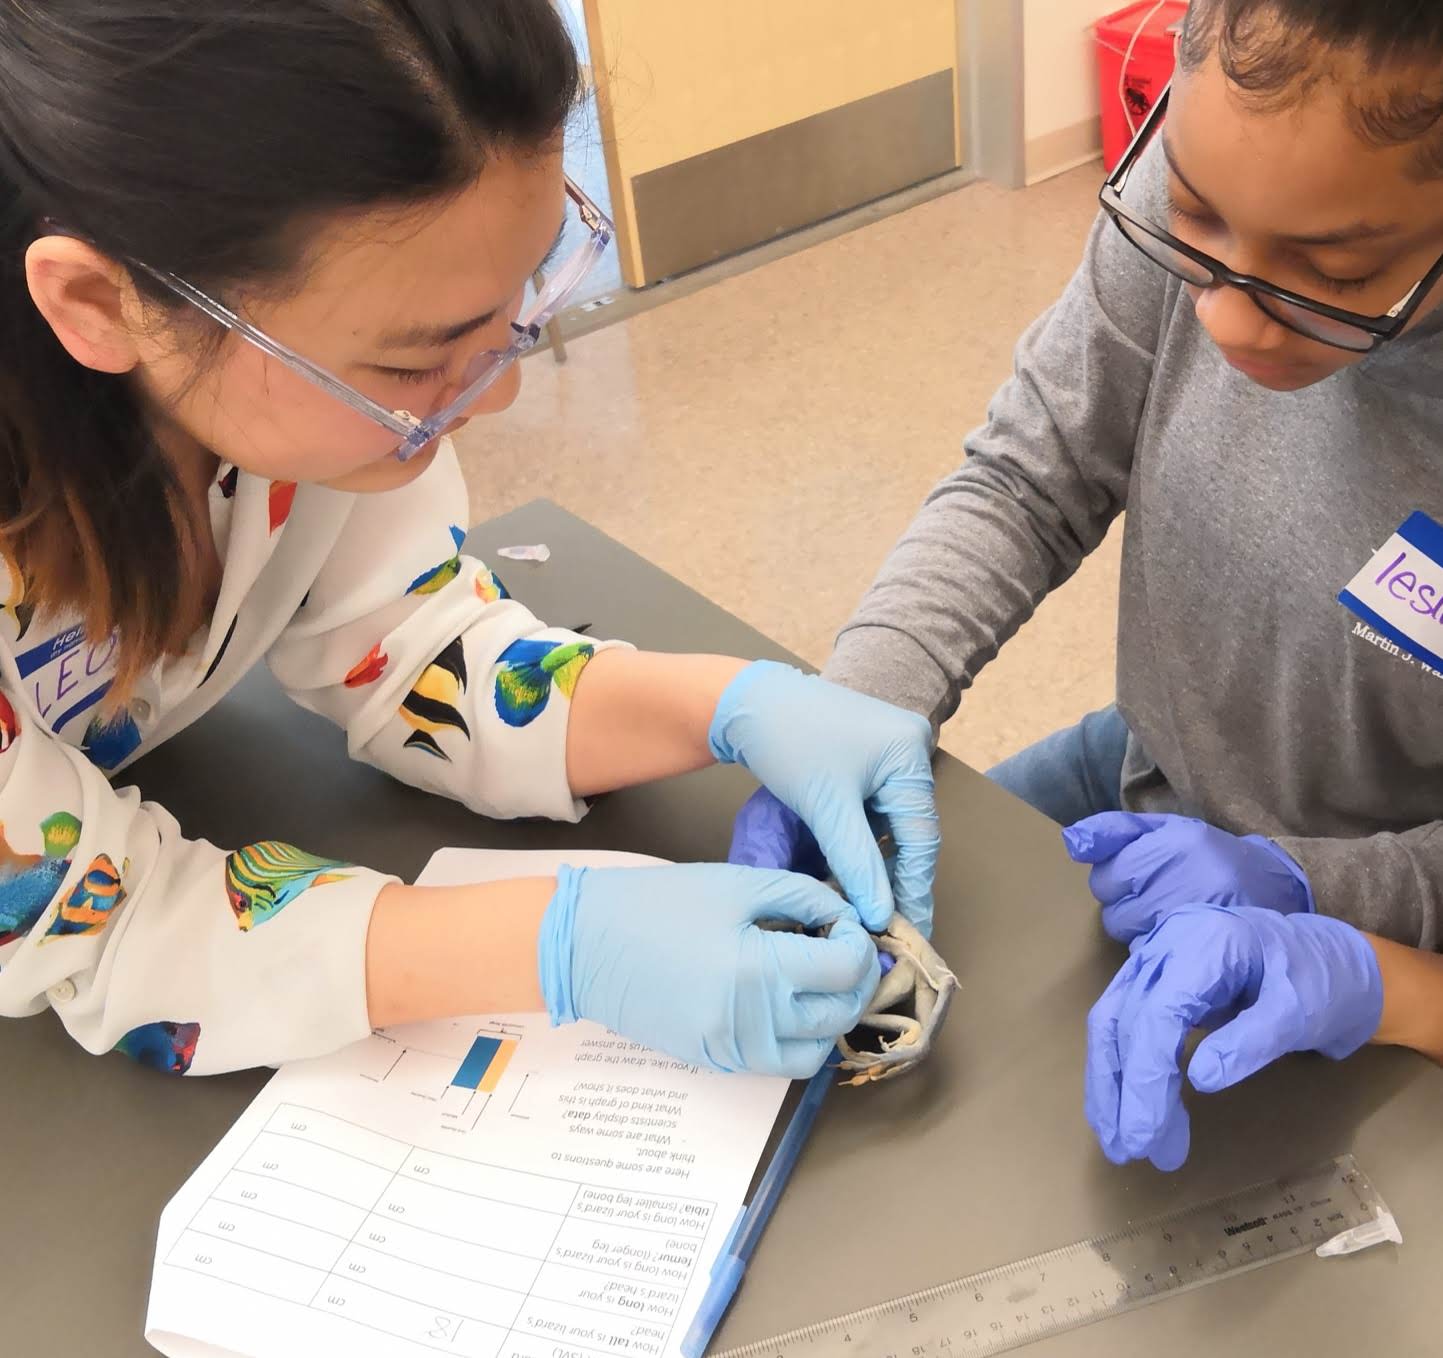
Figure 1: A student and I examined an Anolis cuvieri specimen.
In this activity, students from the Boston Girls Leadership Group measured four different specimens of Anolis lizards snout-vent length (size). The lizard specimens were borrowed from the Harvard Museum of Comparative Zoology where I work.
The goals of this activity were multi-fold:
to familiarize participants with the purpose of scientific specimens and a scientific collection,
to get them to be hands-on and measure lizards like real scientists do, and
to get them to put their data in and make graphs (this is the R part).
After the lizards’ snout-vent length was measured (which both disgusted and delighted the participants due to the “ick” factor), the data was input into Excel.
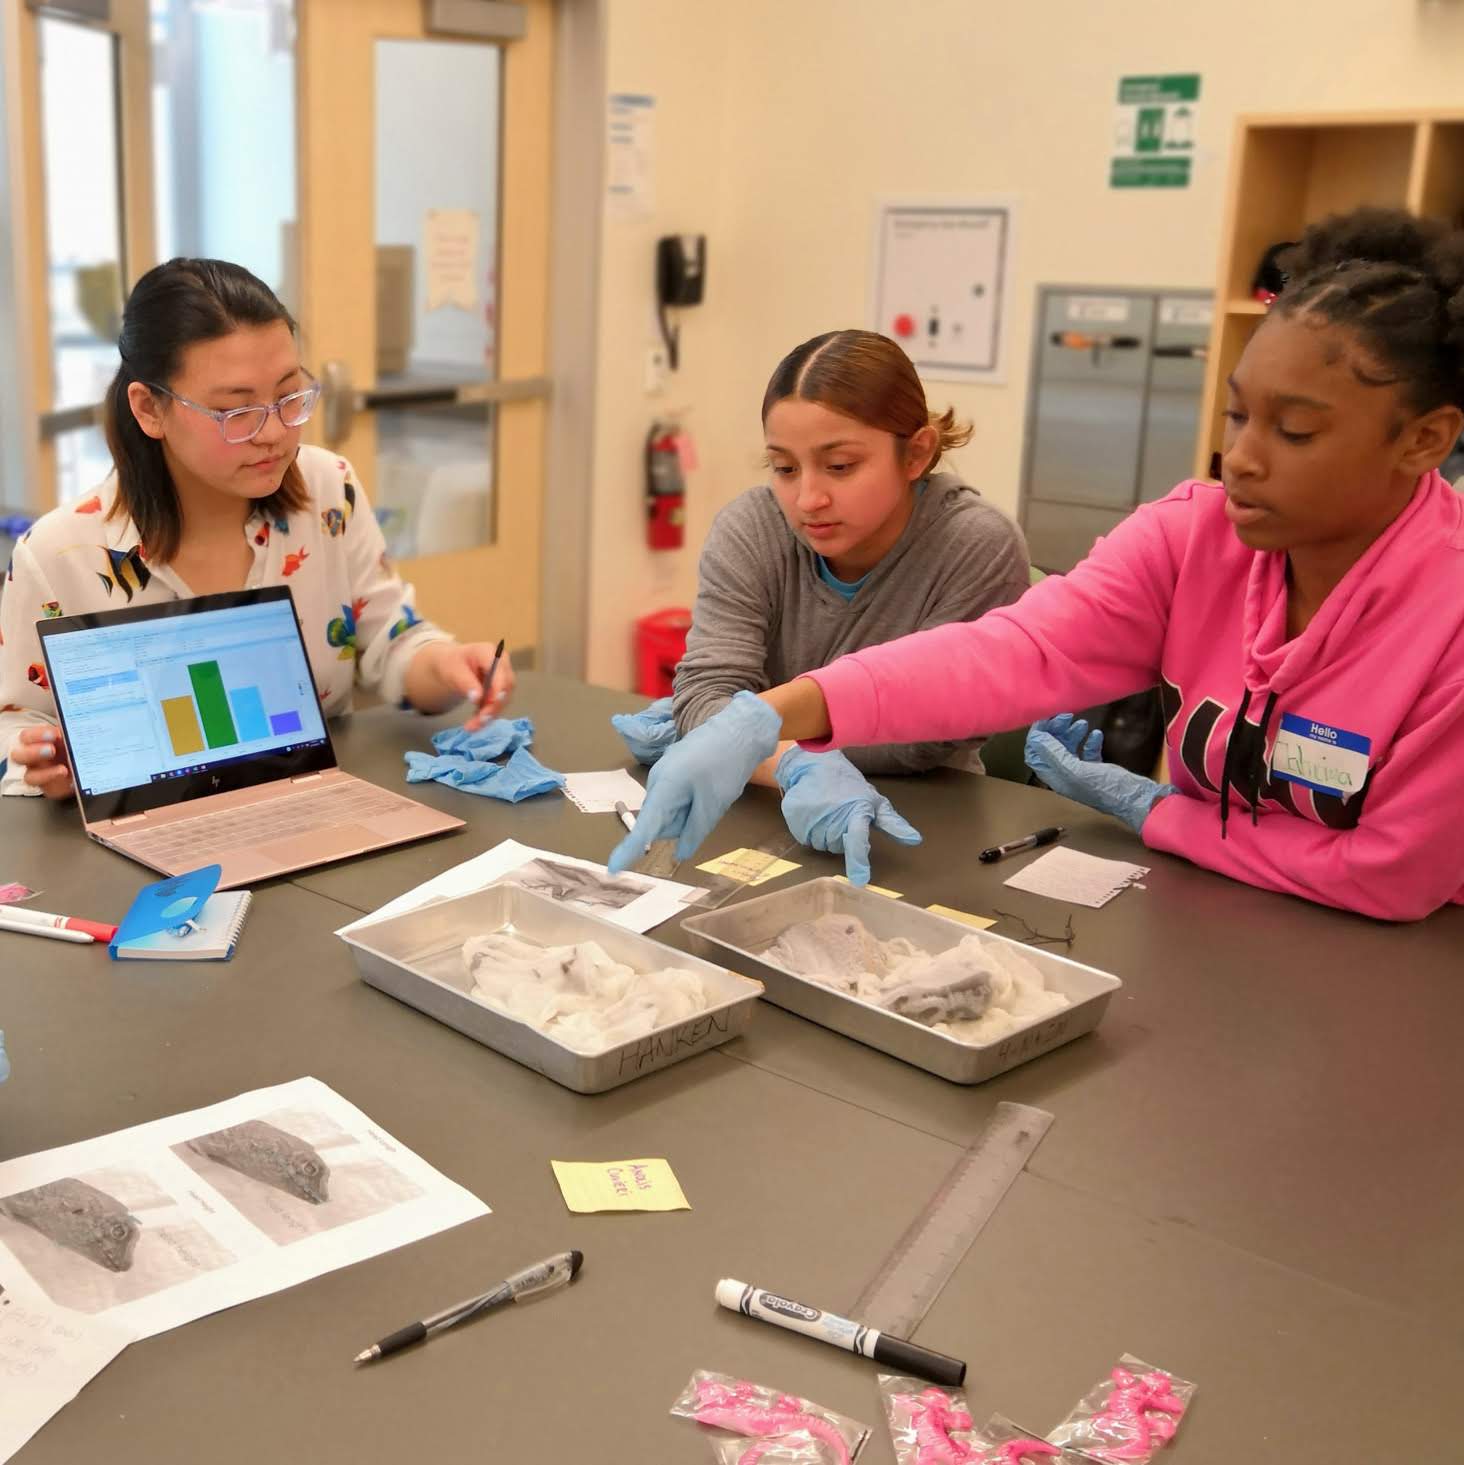
Figure 2: Students reach for specimens in trays to examine.
And here’s the result! The graph below was created by piping in the measurements from the Excel file. A stacked mutate() and summary() function created the y-variable of mean size, and the fill() in ggplot mapped the species to colors, creating an easy to understand and very visual plot.

The beautiful graph aside, there were some issues that I’m planning on wrangling for the next time around. First, sometimes when the middle schoolers entered their data, Excel misunderstood it as a date and R didn’t read the measurements correctly. Second, in the half hour activity there wasn’t enough time to explain adequately that R is a statistical languag that’s super important and can do a lot of other things besides create cool graphs. In the future, my lab and I have discussed making a Shiny for the data ao it’s easy for users to put in measurements and watch directly as the graph is built for them.
Despite the fact that there was some issues with the code, the activity was a success. It was great to participate in such an activity which hopefully inspired future steminists & R-ladies!