The Bee Movie
The Bee Movie is possibly one of the most infamous and widely-memed movies. Hell, a human woman falls in love with a weirdly sexualized bee played by Jerry Seinfield, and many laws of physics are broken - what could be better?
After seeing this TikTok where a person creates a script in Python to write the Bee Movie script by text, I decided to do some sentiment analysis with the Bee Movie script (which I downloaded here)
Word Frequency
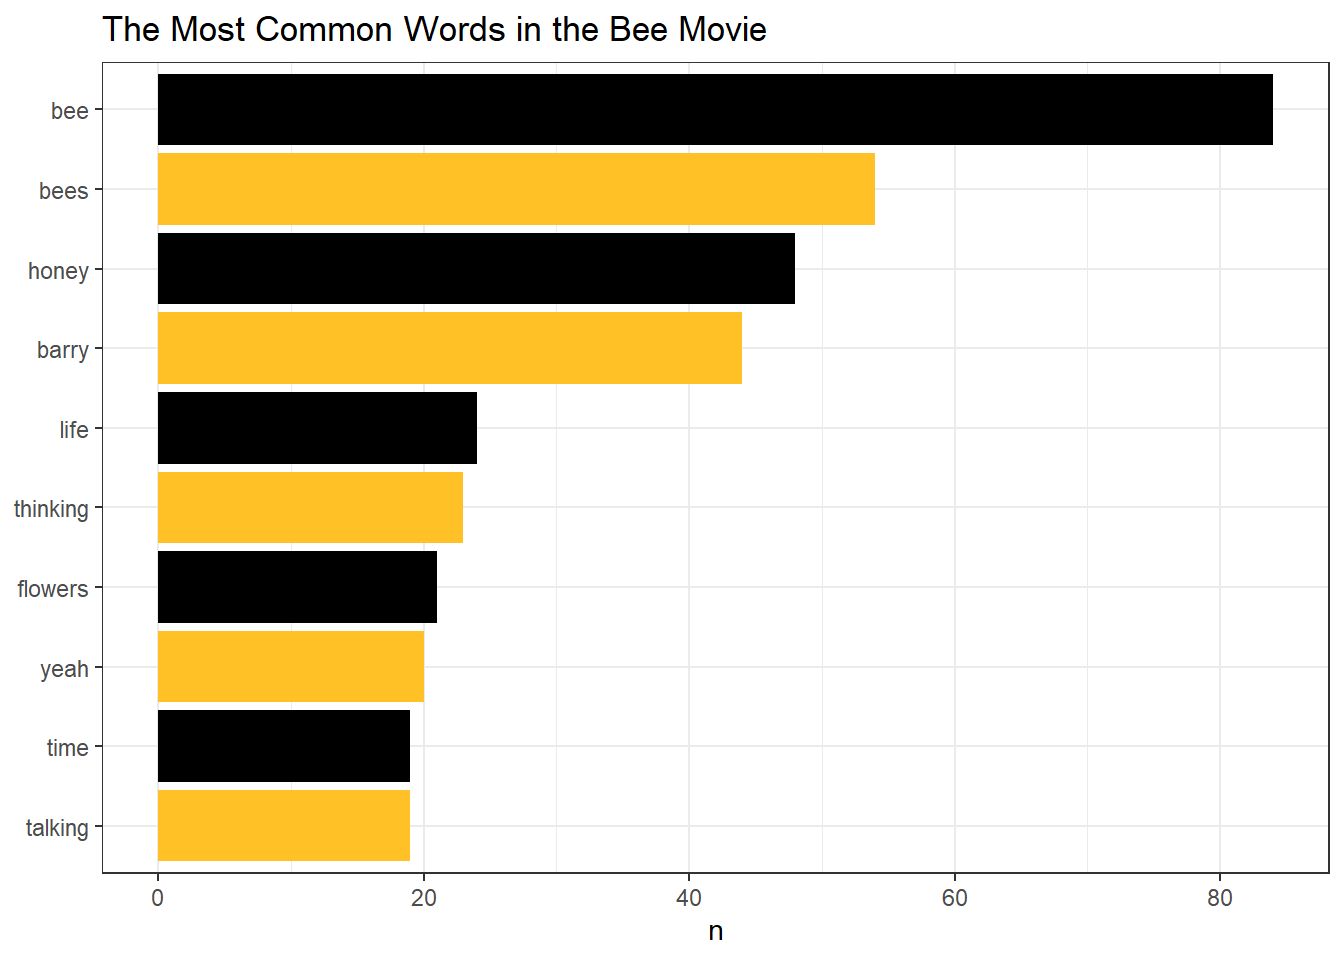
I made this cute little graph that shows the word frequency.
tokenized_bee_movie %>%
  count(word, sort= TRUE) %>%
  top_n(10) %>%
  mutate(word = reorder(word,n)) %>%
  ggplot(aes(word,n, fill=word)) +
  geom_col() +
  xlab(NULL) +
  coord_flip() +
  labs(title="The Most Common Words in the Bee Movie") +
  scale_fill_manual(values=c("goldenrod1","black","goldenrod1","black","goldenrod1","black","goldenrod1","black","goldenrod1","black")) +
  theme_bw() +
  theme(legend.position="none")
## Selecting by n
Zipf’s Law
The new addition to this script that makes it different from the many, many, many word frequency graphs I’ve made on this blog before (apparently amateur text-mining is my thing) is that today I used Zipf’s Law.
zipfs_bee_movie %>%
  ggplot(aes(rank,term_frequency)) +
  geom_line(col="goldenrod", lwd=2) +
  scale_x_log10() +
  scale_y_log10() +
  theme_bw() +
  labs(title="Zipf's Law for the Bee Movie")

Zipf’s Law states that the frequency of any word is inversely proportional to its rank in the frequency table of the words. We can test whether Zipf’s Law holds true by calculating a score that relates the rank to the row number. I used this formula: (row \ number / term \ frequency) to create a score for each and graphed it on a log-log axes as done here.
The resulting graph is supposed to be a fairly straight line, which seems to suggest that the Bee Movie script generally follows Zipf’s Law. That being said, there seem to be lots of words which are used only once because they seem to have low rank and aren’t very frequent. That being said, I may have misinterpreted this graph incorrectly because I have never worked with Zipf’s Law before.